


The Spanish Fort real estate market is relatively small compared to the other cities in Baldwin County. However, there were 88 single family homes that sold in the city this past winter. Wow! Spanish Fort is exploding so I wanted to share with you the neighborhoods that buyers made the most popular.
All of the figures on this page were taken from the sales of single family homes in the winter of 2017 (January, February, and March).
For the 88 homes that sold in Spanish Fort as a whole, here are some statistics.
- $284,103 - average list price
- $275,241 - average selling price
- $98.27% - sold to list price ratio
- $109.02 - average price per square foot
- 2,510.88 - average square feet sold
The links below will take you to the real estate page for that particular neighborhood and will include active listings, property details, and photos.
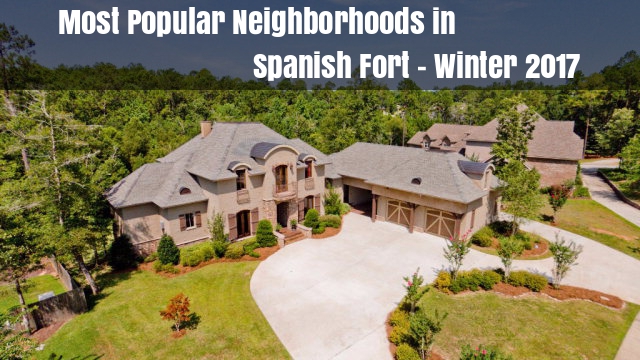
The Most Popular Neighborhoods in Spanish Fort - Winter 2017
1. Stonebridge
- 20 homes sold
- $287,808 - average selling price
- $113.52 - average price per foot
- from 1,659 to 3,140 square feet
- 9 homes sold
- $230,767 - average selling price
- $95.05 - average price per foot
- from 1,850 to 3,600 square feet
3. Churchill
- 8 homes sold
- $243,713 - average selling price
- $107.19 - average price per foot
- from 1,667 to 2,852 square feet
4. Stone Brook
- 8 homes sold
- $183,704 - average selling price
- $107.81 - average price per foot
- from 1,618 to 1,856 square feet
5. Timbercreek
- 6 homes sold
- $288,428 - average selling price
- $119.87 - average price per foot
- from 1,489 to 4,575 square feet
6. Stillwater
- 5 homes sold
- $561,445 - average selling price
- $132.55 - average price per foot
- from 3,340 to 6.052 square feet
If you would like to see information on all of the neighborhoods of Spanish Fort, click here.
For more information about these neighborhoods or to see any of the homes that interest you in person, please contact me.
Jeff Nelson
IXL Real Estate – Eastern Shore
251-654-2523
jeff@livegulfshoreslocal.com
